This 2025 edition of our Airport Industry Connectivity Report comes at both a critical and interesting time.
Politically, the strong focus on decarbonising our economies (including aviation) has somewhat taken a back seat, with priorities shifted towards building up defence capabilities, addressing our competitiveness gap and safeguarding Europe’s social model and cohesion.
In all of this, air connectivity is extremely relevant – as expressly recognised by the Draghi report.
Indeed, air connectivity is an essential part of strategic autonomy, both in defence and economic terms. Airports are critical infrastructure for military mobility and with every +10% increase in direct connectivity automatically yielding a +0.5% growth in GDP per capita, air connectivity is a major driver of both competitiveness and territorial equality.
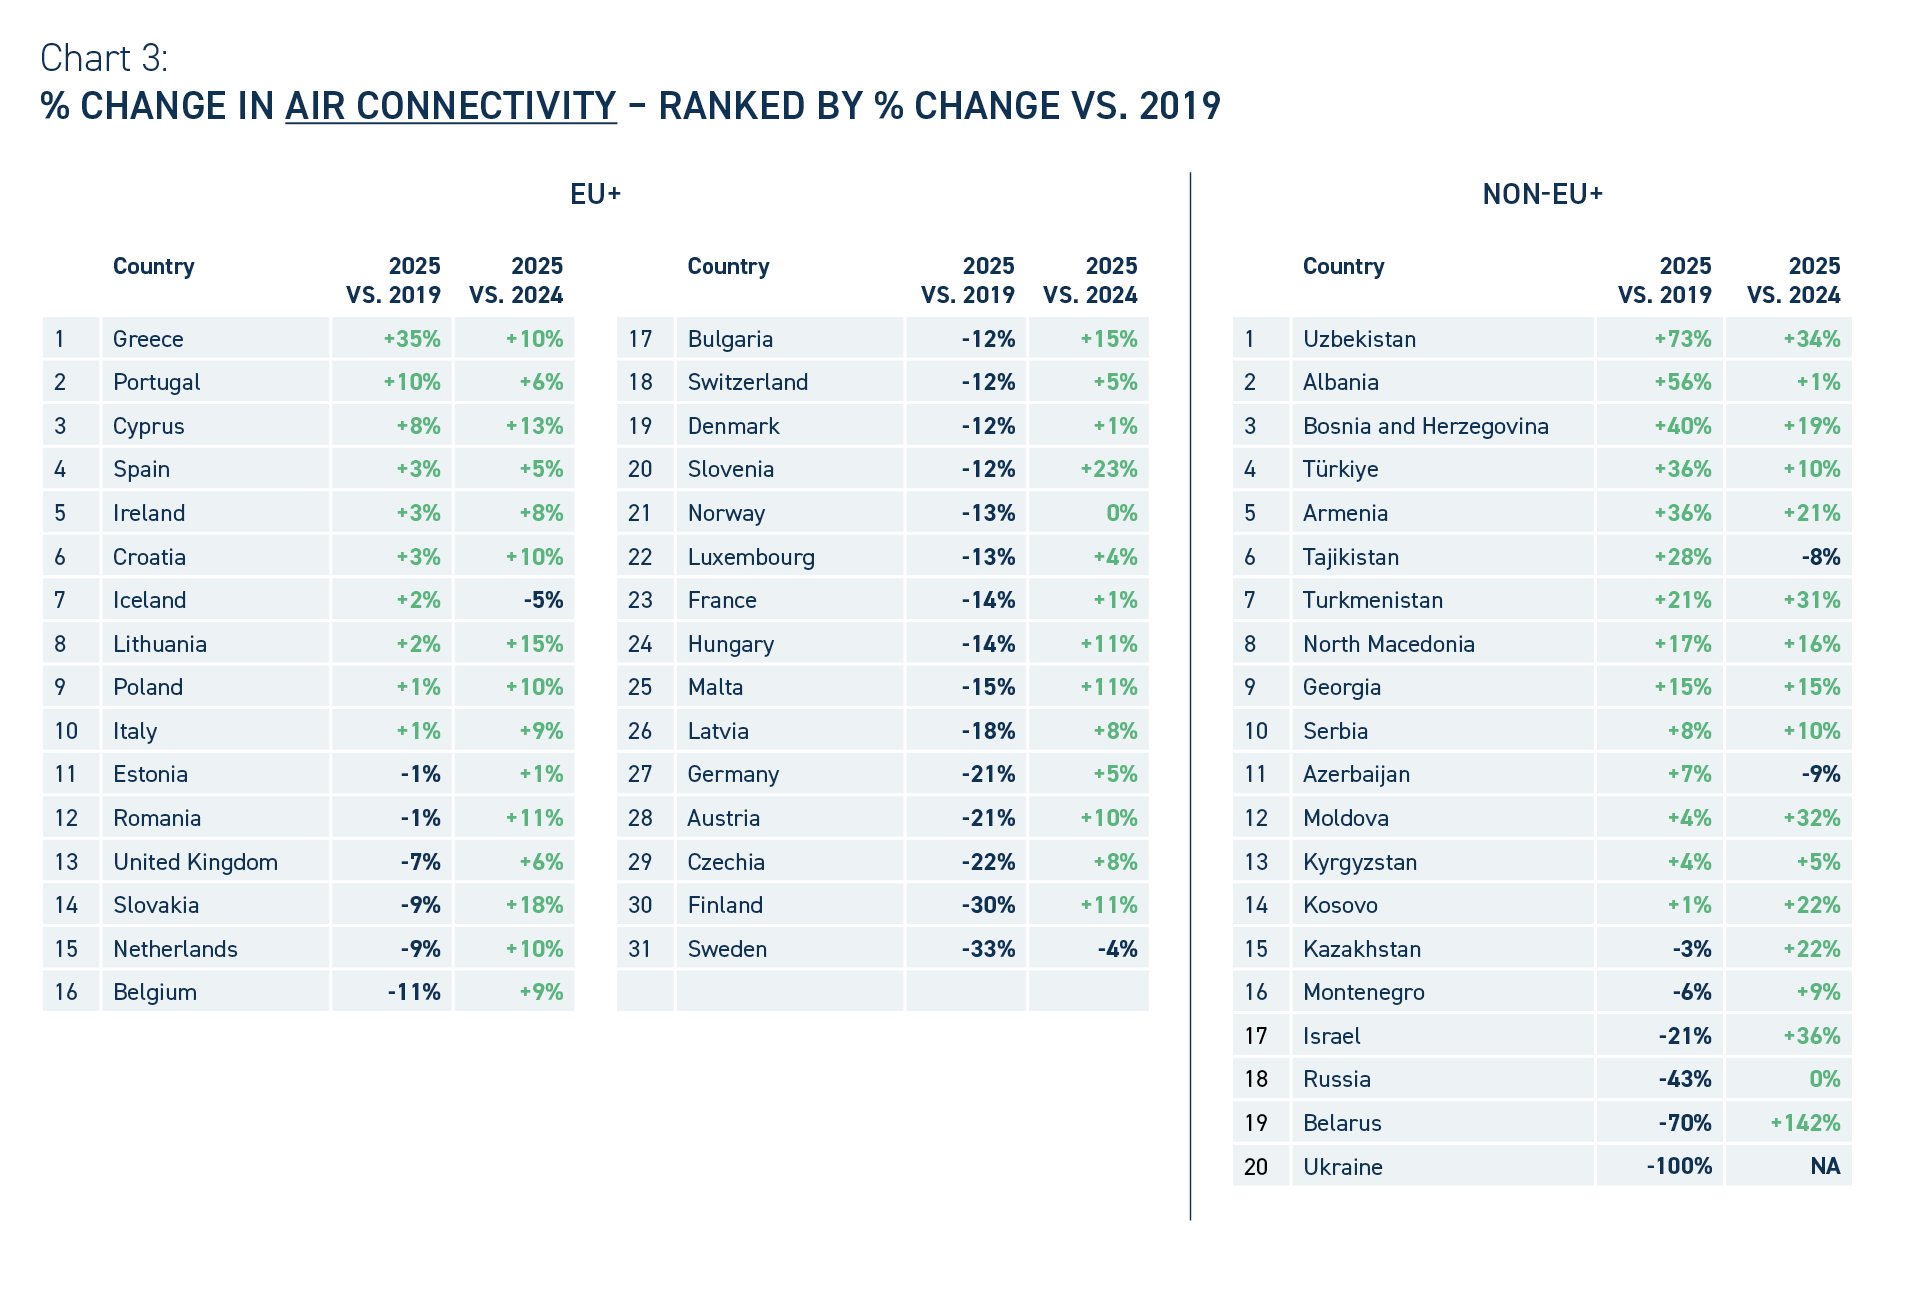
While many of our trading partners (or should we rather now say “geo-economic competitors”?) have long recognised and capitalised on the value of air connectivity as part of their economic development strategies, those doing so in Europe are a rather rare breed – with Türkiye obviously being a notable exception, and the United Kingdom intent on doing the same.
Now is the time for a reality check and for Governments and policy makers (particularly in the EU) to look at air connectivity strategically. This means taking stock of the fact that air connectivity, and with it aviation, are not just about soft power. Rather, they deliver crucial economic and social benefits, ensure effective global positioning – and can even play a role in projecting hard power capabilities.
By contributing to a better understanding of air connectivity dynamics across our continent, I hope the data and analysis contained in this report will make a meaningful contribution to future-proofing the air connectivity that is inherent to our European way of life. This requires safeguarding and developing air connectivity all while making it more sustainable and delivering on our Net Zero commitments.
Olivier Jankovec
ACI EUROPE Director General